CHAPTER 6 PETROLEUM RESERVOIR ENGINEERING AND ENHANCED RECOVERY PROCESSES
| Jurisdiction | United States |
(2001)
PETROLEUM RESERVOIR ENGINEERING AND ENHANCED RECOVERY PROCESSES
Gemini Solutions, Inc.
Houston, Texas
[Page 6-1]
6.01 Introduction
6.02 Reservoir Rock and Fluid Properties
6.03 Reservoir Drive Mechanisms
[1] Depletion Drive Oil Reservoirs
[2] Depletion Drive/Gas Cap Expansion Drive Oil Reservoirs
[3] Water Drive Oil Reservoirs
[4] Depletion Drive Dry Gas Reservoirs
[5] Water Drive Dry Gas Reservoirs
6.04 Original Hydrocarbons In Place
[1] Analogy
[2] Volumetrics
[3] Materials Balance
6.05 Predicting Future Performance
[1] Recovery Factor
[2] Decline Curve Analysis
[3] Reservoir Simulation
6.06 Improved Recovery Processes
[1] Secondary Recovery
[a] Waterflooding
[b] Immiscible Gas Injection
[c] Gas Cycling (Retrograde Condensate Reservoirs)
[2] Enhanced Oil Recovery
[a] Miscible Gas Injection
[b] Chemical Flooding
[c] Thermal Recovery
6.07 Drainage Patterns
6.08 Summary
6.09 References and Acknowledgments
[Page 6-2]
6.01 Introduction
The profession of Petroleum Engineering is currently divided into five main technical categories by the Society of Petroleum Engineers (SPE): Drilling and Completions, Production Engineering, Formation Evaluation, Reservoir Engineering and Related Technologies. Each of these groups has a large number of sub-specialties that cover virtually all areas of science and engineering that can be applied to the upstream petroleum industry. Petroleum engineers also have close links to many other disciplines. For a reservoir engineer, the most closely linked discipline is geology. It is almost impossible for someone involved in the technical aspects of reservoir engineering to effectively carry out his responsibilities without a good working knowledge of geologic fundamentals. Reservoir engineers are typically tasked with determining the following:
A. Original oil and gas in place,
B. Drive mechanism(s),
C. Recovery factor under natural depletion and enhanced recovery processes,
D. Time schedule for recovering the hydrocarbons,
E. Economic feasibility of a recovery project.
This paper will cover each of the technical tasks (A-D) as they pertain to different types of reservoirs. In addition, fundamental reservoir rock and fluid properties will be briefly described.
6.02 Reservoir Rock and Fluid Properties
In order to understand the various recovery processes and related calculations, it is necessary to be familiar with several of the variables that are found in reservoir engineering equations.
Porosity (Phi) is the pore volume (void space) in a rock that is available to store fluid divided by the bulk volume of the rock.
Porosity=Pore Volume / Bulk Volume
For example, if a piece of rock has a bulk volume of 2.5 cubic feet, and an internal pore volume of 0.5 cubic feet, the porosity is 0.2 or 20% (Phi=0.5/2.5=0.2). The higher the porosity, the greater the pore volume available to store oil and gas.
There are two types of porosity, total and effective. Total Porosity reflects the total pore space, while Effective Porosity only includes the interconnected pore space that allows for fluid flow from one pore to the next. As petroleum engineers, we are typically only concerned with fluid that can flow through the rock and be produced by a wellbore. Some formations have porosity that is isolated as small vugs and should not be included in calculations. It is important to make sure that any total porosities from certain well log and core sample measurements are modified before being reported or used in calculations. Otherwise, the Original-Oil-In-Place (OOIP), Original-Gas-In-Place (OGIP) and potential recovery will be overstated.
Permeability (k) is the measure of a rock's ability to transmit fluid. Pores in a rock are
[Page 6-3]
connected through throats that restrict flow. The larger the throat opening, the less resistance to flow. The units are length squared (e.g., square feet, square meters, etc.). However, due to the small size of a pore throat, the standard units are millidarcies (md). For example, a small straw typically found in a cocktail would have a 50,000,000 md permeability. Tight gas sands found throughout the western United States can have permeabilities less than 0.1 md, and more permeable sands found in the California steamfloods may have over 2,000 md permeability. The higher the permeability, the easier the oil or gas in the reservoir can flow. Figure 1 has two limestone core samples from the same field. The core sample on the right has numerous small vugs and appears to have excellent flow properties. However, this vugular limestone has high total porosity that is not interconnected. The resulting permeability is low. The core sample on the left has smaller, but more uniform pore sizes. Most of the pores are in communication with one another, and the total and effective porosities are similar. The resulting permeability is higher than in the vugular sample, and this type of rock is the productive member of the field.
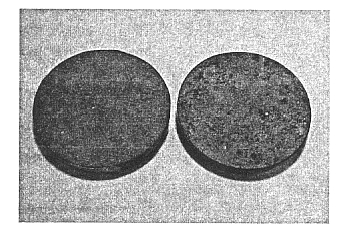
Figure 1 — Limestone reservoir core samples
Reservoir engineering calculations typically include the thickness of the formation. If a formation is twenty feet thick, this is the gross thickness. Gross Thickness (hg) includes the full thickness from the top to the bottom of the interval. However, only the portion of the formation that contributes to flow should be used in calculations. Any shales or other non-productive intervals should be subtracted from the gross thickness to determine the Net Thickness (hn). In the event that the entire formation thickness is productive, the gross and net thicknesses are equal.
Formation Volume Factor (Bo, Bg, or Bw) is the ratio of the volume of oil, gas or water at reservoir conditions to the volume at surface conditions. In the reservoir, the fluid is at higher pressure and temperature as compared to surface conditions. As the fluid moves up the wellbore to the surface, pressure and temperature decrease, gas that is dissolved in oil and water under reservoir conditions begins to come out of solution and form a free gas phase, the liquid shrinks and the gas expands. As the reservoir pressure declines over time, the values of these formation volume factors change. An example value at original reservoir conditions for Bo is 1.3 reservoir barrels/stock tank barrel (rb/stb), and for Bg is 0.003 reservoir cubic feet/standard cubic foot (rcf/scf).
[Page 6-4]
Solution and Producing Gas/Oil Ratios (Rs and Rp) are the ratios of gas to liquid oil. The Solution Gas/Oil Ratio is the volume of gas dissolved in one barrel of oil. As the pressure in a reservoir decreases, the solution gas/oil ratio remains constant until the oil can no longer contain all the dissolved gas. At the point the first gas bubble forms out of the oil (Bubble Point), the solution gas/oil ratio begins to decrease. The Producing Gas/Oil Ratio is the volume of produced gas/barrel of stock tank oil. Water also contains dissolved gas. However, since the amount of gas dissolved in water is so low compared to the gas dissolved in oil, gas exsolution from water is usually ignored in reservoir engineering calculations.
Viscosity (u) of a fluid is the fluid's own internal resistance to flow. High viscosity fluids are "thick" and will not easily flow. An example is maple syrup. Low viscosity fluids are "thin" and flow easily. Water has low viscosity and gas has very low viscosity. Given a reservoir with fixed rock properties, high viscosity oil will produce much more slowly than low viscosity oil.
Oil reservoirs contain water, oil and the gas dissolved in the oil and water. In addition, some oil reservoirs have free gas sitting on top of the oil. This gas is called a Gas Cap. Determining these Gas, Oil and Water Saturations is usually necessary before performing reservoir engineering calculations. The saturations are determined from well log analyses, core data and pressure/depth calculations. Figures 2 and 3 show an oil reservoir (green) with an underlying water aquifer (blue) and an overlying gas cap (red). At the interfaces between the oil and water and oil and gas, there are Transition Zones where both phases (oil/water or oil/gas) are mobile. The transition zone can vary in thickness from inches to hundreds of feet, depending on the reservoir rock and fluid properties. In Figures 2 and 3, the transition zones are shown as light blue (oil/water transition) and yellow (gas/oil transition).
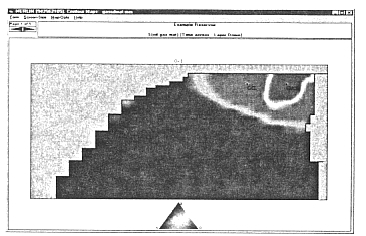
Figure 2 — Reservoir contour map with gas cap, oil zone and water aquifer
[Page 6-5]
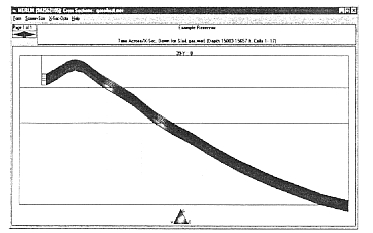
Figure 3 — Reservoir cross-section map with gas cap, oil zone and water aquifer
When multiple saturations are present, each phase has its own effective permeability. However, the sum of these permeabilities does not add up to the single-phase effective permeability discussed above. Figure 4 shows a typical set of Relative Permeability curves. The curves are concave upwards since phases interfere with one another, resulting in lower effective permeability than expected.
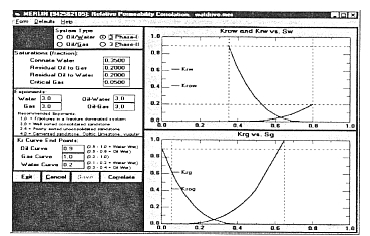
Figure 4 — Relative permeability curves
6.03 Reservoir Drive Mechanisms
Gas and oil reservoirs usually produce early in their life using their own drive energy. This energy is provided by fluid expansion as the pressure decreases or by natural water influx. The reservoir shown in Figures 2 and 3 will be modified in the following discussion to illustrate different types of reservoir behavior.
[Page 6-6]
[1] Depletion Drive Oil Reservoirs
Depletion Drive Oil Reservoirs are also called Solution Gas Drive Reservoirs. In this example, we have an oil reservoir at a pressure above its bubble point. This is called an Undersaturated Reservoir, in that all the free gas has moved into solution in the oil, and the oil could actually hold more gas in solution if the gas were available. There is neither free gas nor a water aquifer in this...
To continue reading
Request your trial