- Home
- Books and Journals
- FNREL - Special Institute
- Air Quality Regulation For The Natural Resources Industry (FNREL)
CHAPTER 3 GREENHOUSE GAS EMISSIONS RISK, IMPACTS AND OPPORTUNITIES
| Jurisdiction | United States |
(2000)
GREENHOUSE GAS EMISSIONS RISK, IMPACTS AND OPPORTUNITIES
The Greenhouse Emissions Management Consortium Vancouver, British Columbia
Denver, Colorado
Who Is GEMCo?
• BC Gas Ltd.
• BC Hydro
• Canadian Utilities Ltd.
• Enbridge/Consumers Gas Ltd.
• EPCOR
• Trans Canada Pipelines Limited
• Nova Scotia Power Inc.
• Ontario Power Generation Inc.
• SaskPower
• TransAlta Corporation
[Page 3-2]
The Kyoto Commitment: a New US National "Balance Sheet in Development"?
...consider how things looked as at December 31, 1997
| GHGs, million metric tonnes, CO2e | ||
| One Year | Kyoto Period | |
| Assets | ||
| Kyoto Allocation* | 4,647 | 23,234 |
| Allocation Adjustments arising from Inventory Adjustments | ||
| Allocation Adjustments | ||
| Firm Contracts to Reduce Emissions (RE) with Existing US Sources | ||
| Firm Contracts to Enhance (SC) US Sinks | ||
| Firm, Securitized Contracts to RE or SC in Nations with Commitments | ||
| Firm, Securitized Contracts to RE or SC in CDM Nations | ||
| Total Assets | 4,647 | 23,234 |
| Liabilities | ||
| Actual US GHG Emissions @ Dec 31, 1997 | 5,504 | 27,518 |
| US Credits Issued for Actions taken prior to Dec., 1997 retirements) & provision for new sources Jan/1998 to Dec/2012** | ||
| Set-aside for Growth Jan/1998 to Dec/2012** | 1,162 | 5,809 |
| Set-aside for sink depletion Jan/1998 to Dec/2012** | 110 | 550 |
| Credits for Actions taken after Dec., 1997, for reductions that occur prior to 2008 — 2012 | ||
| Value of CDM Contracts Underwritten by the US Government | ||
| Total Liabilities | 6,775 | 33,876 |
| Original National Carbon Equity | (2,128) | (10,642) |
| Net Change in National Carbon Equity Due to Early Action |
[Page 3-3]
What is the Potential Shareholder Value Impact of the Future Risk of Select US GHG Emission Limit Scenarios?
| Scenario | Probability | Description of Emission Reduction Goal | Discount Rate (current opportunity cost of capital) | Marginal Cost of Reductions (nominal US$/tonne CO2e) | Current Market Value of Risk (million constant yr 2000 US$) | Current Value of Risk in constant yr 2000 US$/tonne CO2e |
| 1 | 10% | stabilize to 1990 levels over 2008 to 2012 period | 8.0% | $10.00 | -$2,893 | -$0.34 |
| 2 | 10% | reduce to 1990 levels — 7% over 2008 to 2012 period | 8.0% | $10.00 | -$3,328 | -$0.34 |
| 3 | 20% | reduce to 1990 levels — 7% over 2008 to 2012 period | 8.0% | $10.00 | -$6,657 | -$0.68 |
| 4 | 20% | reduce to 1990 levels — 7% over 2008 to 2012 period | 12.0% | $10.00 | -$4,114 | -$0.42 |
| 5 | 32% | reduce to 1990 levels — 7% over 2008 to 2012 period | 12.0% | $15.00 | -$9,874 | -$1.01 |
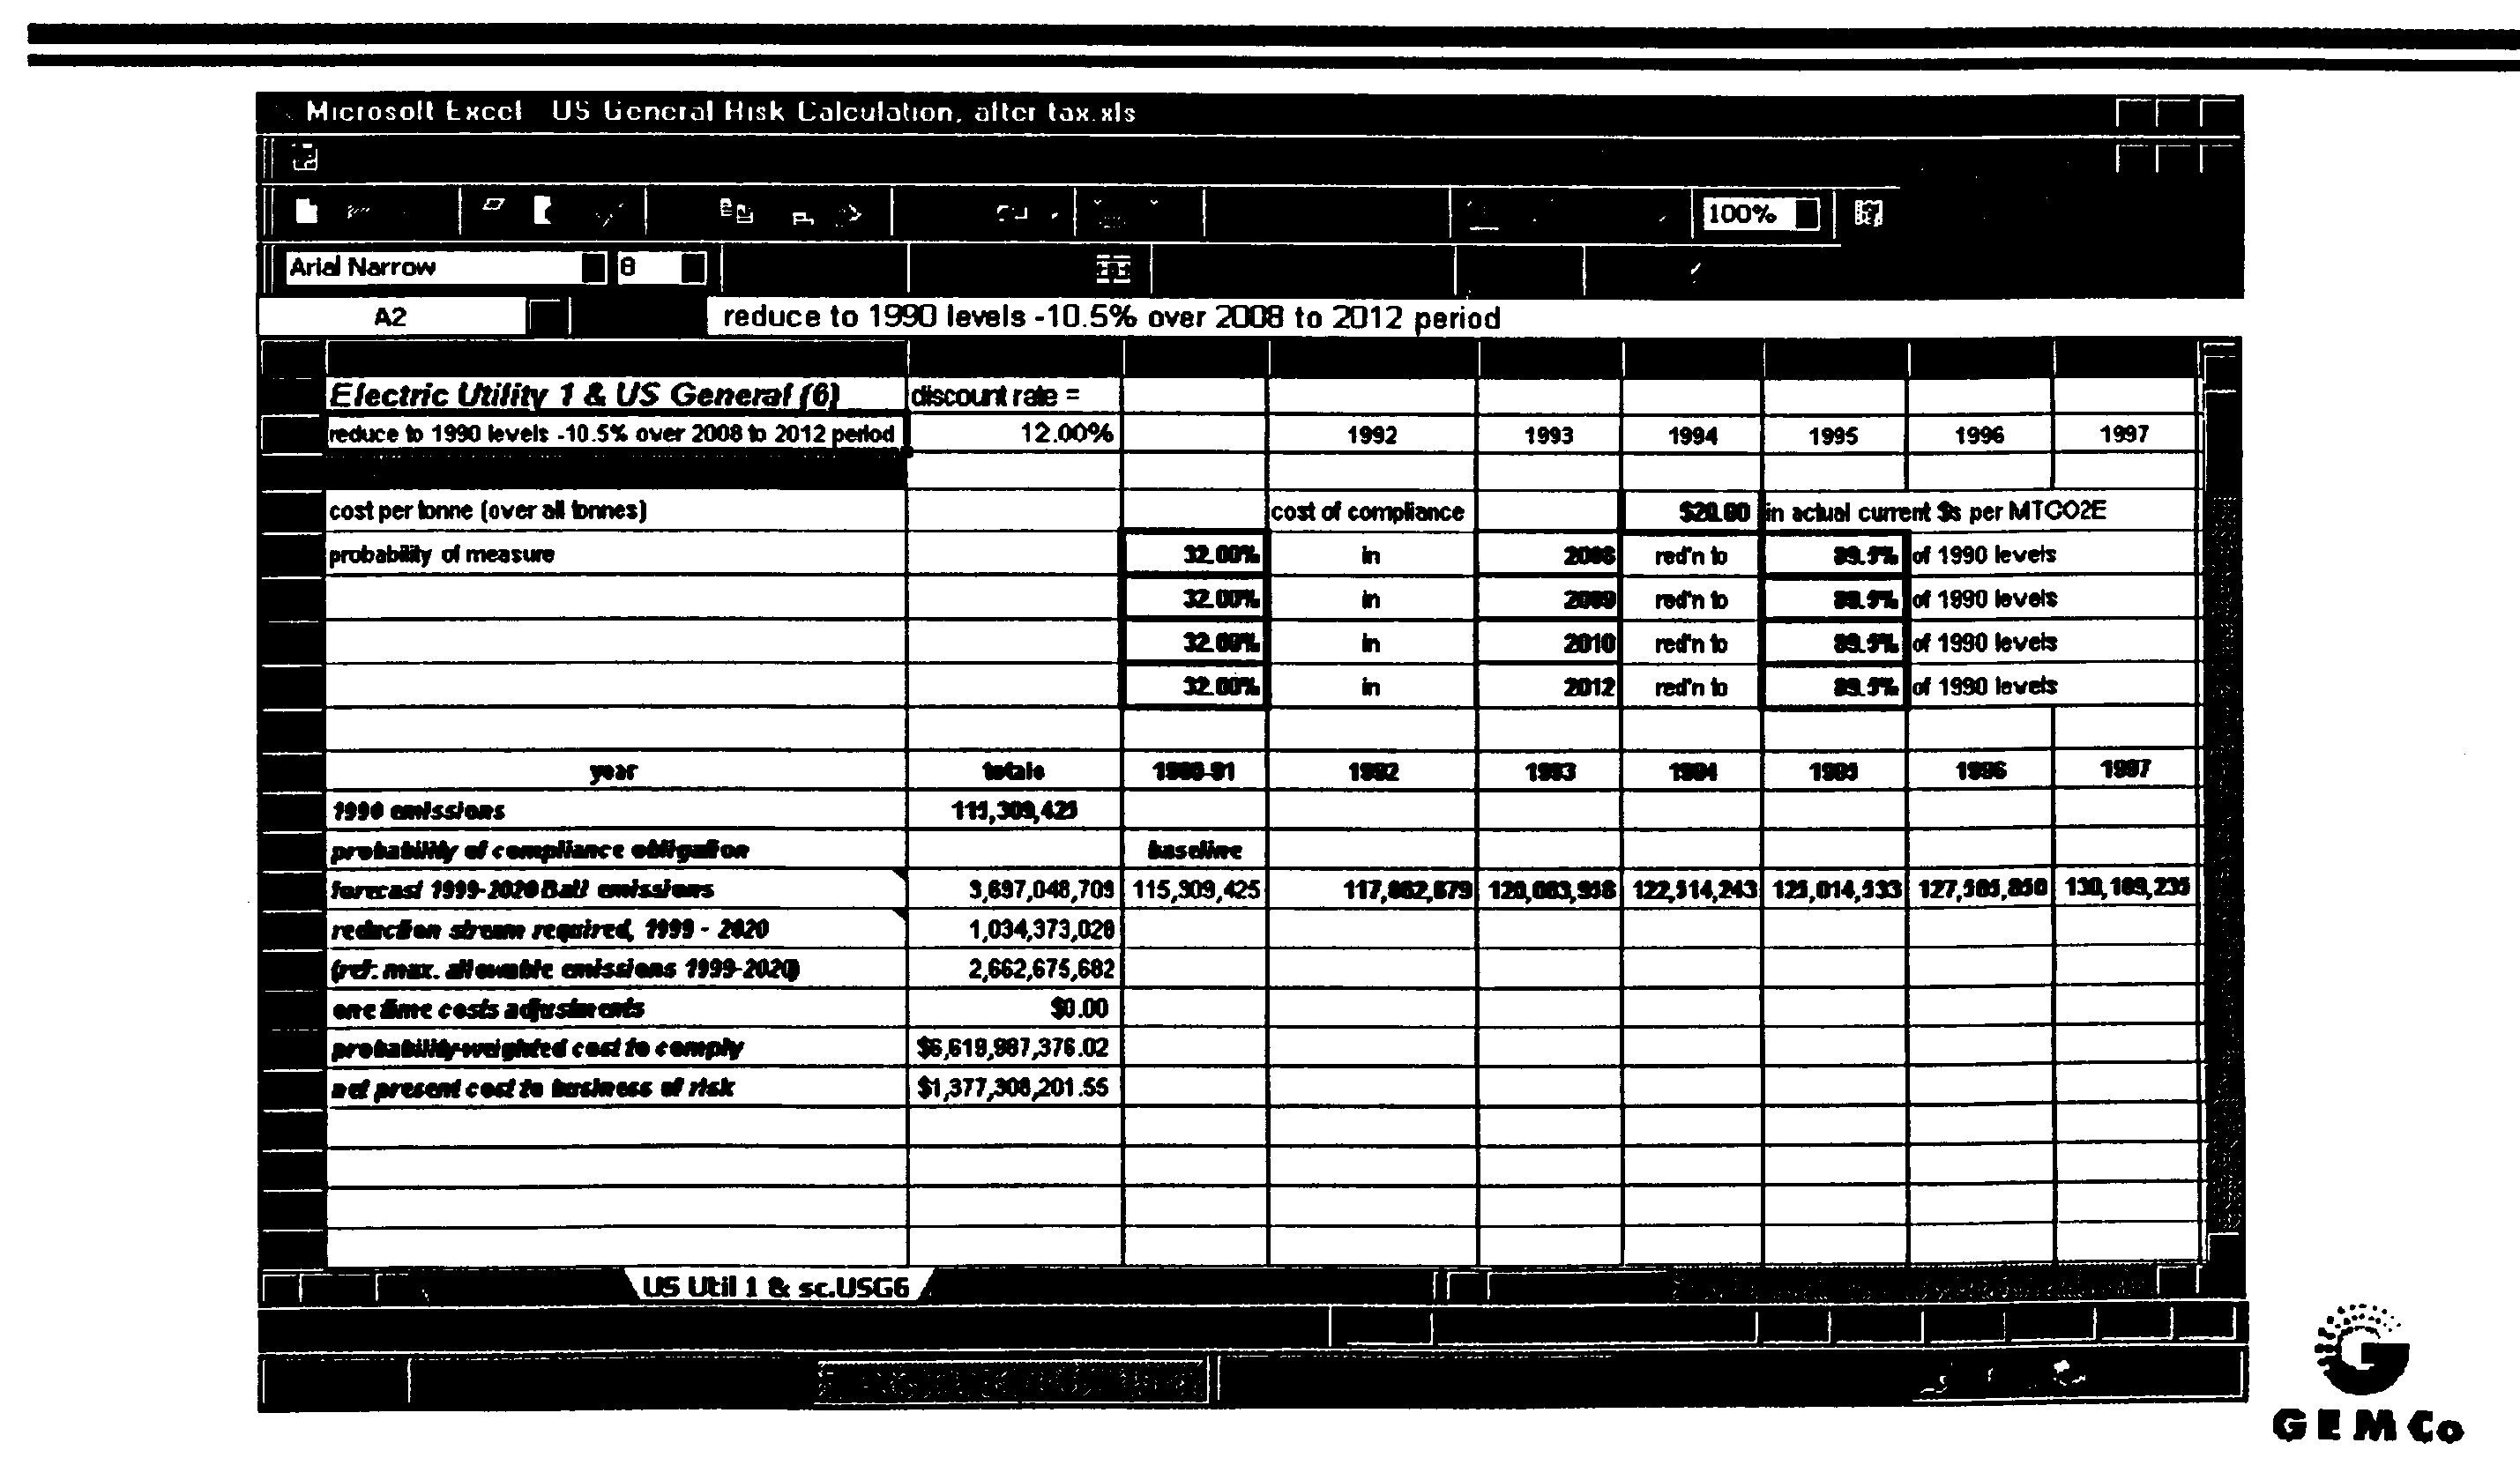
| 6 | 32% | reduce to 1990 levels — 10.5% over 2008 to 2012 period | 12.0% | $20.00 | -$14,042 | -$1.35 |
[Page 3-4]
To Any Individual Entity, What is the Current Market Value of the Future Risk of Regulation of or Other Barriers to Carbon Trade?
[Page 3-5]
How Does This Risk Affect an Entity's Critical...
To continue reading
Request your trial- FNREL - Special Institute
- Air Quality Regulation For The Natural Resources Industry (FNREL)
- TABLE OF CONTENTS
- CHAPTER 1 THE LEGISLATIVE HISTORY OF U.S. AIR POLLUTION CONTROL
- CHAPTER 2 IMPLICATIONS OF REVISED PM NATIONAL AMBIENT AIR QUALITY STANDARDS (NAAQS) ON RESOURCE DEVELOPMENT
- CHAPTER 3 GREENHOUSE GAS EMISSIONS RISK, IMPACTS AND OPPORTUNITIES
- CHAPTER 4 REGIONAL HAZE AND VISIBILITY: STATE AND FEDERAL ROLES
- EPA REGIONAL HAZE RULE LITIGATION UPDATE
- WESTERN REGIONAL AIR PARTNERSHIP (WRAP) AND THE GRAND CANYON VISIBILITY TRANSPORT COMMISSION: A STATE PERSPECTIVE
- CHAPTER 6 THE NEW OZONE STANDARD AND FOSSIL FUELS
- CHAPTER 7 FUGUE AND VARIATIONS: PREVENTION OF SIGNIFICANT DETERIORATION AND NEW SOURCE REVIEW
- CHAPTER 8 AIR PERMITTING HURDLES: A PRACTICAL PERSPECTIVE BASED ON THE OREGON PERMITTING EXPERIENCE
- CHAPTER 9 EMISSIONS TRADING ON LOCAL, REGIONAL, NATIONAL, AND INTERNATIONAL SCALES
- CHAPTER 10 HAZARDOUS AIR POLLUTANTS: AN UPDATE OF ACTIVITIES UNDER SECTION 112 OF THE CLEAN AIR ACT
- CHAPTER 11 CONTROL OF AIR POLLUTION FROM MOTOR VEHICLE TRANSPORTATION BY THE FEDERAL AND STATE GOVERNMENTS
- CHAPTER 12 EMISSIONS MONITORING AND ANY CREDIBLE EVIDENCE
- TRIBAL AUTHORITY TO REGULATE AIR QUALITY
- TRIBAL AIR POLLUTION CONTROL AUTHORITY: A STATE VIEWPOINT
- AN INDUSTRY LAWYER'S PERSPECTIVE ON TRIBAL AIR POLLUTION CONTROL AUTHORITY UNDER THE CLEAN AIR ACT'S “TREATMENT AS STATES” PROVISION
- CHAPTER 14 ENVIRONMENTAL JUSTICE
- CHAPTER 15 CLEAN AIR ACT ENFORCEMENT: A FOCUS ON OVERFILING
Subscribers can access the reported version of this case.
You can sign up for a trial and make the most of our service including these benefits.
Why Sign-up to vLex?
-
Over 100 Countries
Search over 120 million documents from over 100 countries including primary and secondary collections of legislation, case law, regulations, practical law, news, forms and contracts, books, journals, and more.
-
Thousands of Data Sources
Updated daily, vLex brings together legal information from over 750 publishing partners, providing access to over 2,500 legal and news sources from the world’s leading publishers.
-
Find What You Need, Quickly
Advanced A.I. technology developed exclusively by vLex editorially enriches legal information to make it accessible, with instant translation into 14 languages for enhanced discoverability and comparative research.
-
Over 2 million registered users
Founded over 20 years ago, vLex provides a first-class and comprehensive service for lawyers, law firms, government departments, and law schools around the world.
Subscribers are able to see a list of all the cited cases and legislation of a document.
You can sign up for a trial and make the most of our service including these benefits.
Why Sign-up to vLex?
-
Over 100 Countries
Search over 120 million documents from over 100 countries including primary and secondary collections of legislation, case law, regulations, practical law, news, forms and contracts, books, journals, and more.
-
Thousands of Data Sources
Updated daily, vLex brings together legal information from over 750 publishing partners, providing access to over 2,500 legal and news sources from the world’s leading publishers.
-
Find What You Need, Quickly
Advanced A.I. technology developed exclusively by vLex editorially enriches legal information to make it accessible, with instant translation into 14 languages for enhanced discoverability and comparative research.
-
Over 2 million registered users
Founded over 20 years ago, vLex provides a first-class and comprehensive service for lawyers, law firms, government departments, and law schools around the world.
Subscribers are able to see a list of all the documents that have cited the case.
You can sign up for a trial and make the most of our service including these benefits.
Why Sign-up to vLex?
-
Over 100 Countries
Search over 120 million documents from over 100 countries including primary and secondary collections of legislation, case law, regulations, practical law, news, forms and contracts, books, journals, and more.
-
Thousands of Data Sources
Updated daily, vLex brings together legal information from over 750 publishing partners, providing access to over 2,500 legal and news sources from the world’s leading publishers.
-
Find What You Need, Quickly
Advanced A.I. technology developed exclusively by vLex editorially enriches legal information to make it accessible, with instant translation into 14 languages for enhanced discoverability and comparative research.
-
Over 2 million registered users
Founded over 20 years ago, vLex provides a first-class and comprehensive service for lawyers, law firms, government departments, and law schools around the world.
Subscribers are able to see the revised versions of legislation with amendments.
You can sign up for a trial and make the most of our service including these benefits.
Why Sign-up to vLex?
-
Over 100 Countries
Search over 120 million documents from over 100 countries including primary and secondary collections of legislation, case law, regulations, practical law, news, forms and contracts, books, journals, and more.
-
Thousands of Data Sources
Updated daily, vLex brings together legal information from over 750 publishing partners, providing access to over 2,500 legal and news sources from the world’s leading publishers.
-
Find What You Need, Quickly
Advanced A.I. technology developed exclusively by vLex editorially enriches legal information to make it accessible, with instant translation into 14 languages for enhanced discoverability and comparative research.
-
Over 2 million registered users
Founded over 20 years ago, vLex provides a first-class and comprehensive service for lawyers, law firms, government departments, and law schools around the world.
Subscribers are able to see any amendments made to the case.
You can sign up for a trial and make the most of our service including these benefits.
Why Sign-up to vLex?
-
Over 100 Countries
Search over 120 million documents from over 100 countries including primary and secondary collections of legislation, case law, regulations, practical law, news, forms and contracts, books, journals, and more.
-
Thousands of Data Sources
Updated daily, vLex brings together legal information from over 750 publishing partners, providing access to over 2,500 legal and news sources from the world’s leading publishers.
-
Find What You Need, Quickly
Advanced A.I. technology developed exclusively by vLex editorially enriches legal information to make it accessible, with instant translation into 14 languages for enhanced discoverability and comparative research.
-
Over 2 million registered users
Founded over 20 years ago, vLex provides a first-class and comprehensive service for lawyers, law firms, government departments, and law schools around the world.
Subscribers are able to see a visualisation of a case and its relationships to other cases. An alternative to lists of cases, the Precedent Map makes it easier to establish which ones may be of most relevance to your research and prioritise further reading. You also get a useful overview of how the case was received.

Why Sign-up to vLex?
-
Over 100 Countries
Search over 120 million documents from over 100 countries including primary and secondary collections of legislation, case law, regulations, practical law, news, forms and contracts, books, journals, and more.
-
Thousands of Data Sources
Updated daily, vLex brings together legal information from over 750 publishing partners, providing access to over 2,500 legal and news sources from the world’s leading publishers.
-
Find What You Need, Quickly
Advanced A.I. technology developed exclusively by vLex editorially enriches legal information to make it accessible, with instant translation into 14 languages for enhanced discoverability and comparative research.
-
Over 2 million registered users
Founded over 20 years ago, vLex provides a first-class and comprehensive service for lawyers, law firms, government departments, and law schools around the world.
Subscribers are able to see the list of results connected to your document through the topics and citations Vincent found.
You can sign up for a trial and make the most of our service including these benefits.
Why Sign-up to vLex?
-
Over 100 Countries
Search over 120 million documents from over 100 countries including primary and secondary collections of legislation, case law, regulations, practical law, news, forms and contracts, books, journals, and more.
-
Thousands of Data Sources
Updated daily, vLex brings together legal information from over 750 publishing partners, providing access to over 2,500 legal and news sources from the world’s leading publishers.
-
Find What You Need, Quickly
Advanced A.I. technology developed exclusively by vLex editorially enriches legal information to make it accessible, with instant translation into 14 languages for enhanced discoverability and comparative research.
-
Over 2 million registered users
Founded over 20 years ago, vLex provides a first-class and comprehensive service for lawyers, law firms, government departments, and law schools around the world.