CHAPTER 2 IMPLICATIONS OF REVISED PM NATIONAL AMBIENT AIR QUALITY STANDARDS (NAAQS) ON RESOURCE DEVELOPMENT
| Jurisdiction | United States |
(2000)
IMPLICATIONS OF REVISED PM NATIONAL AMBIENT AIR QUALITY STANDARDS (NAAQS) ON RESOURCE DEVELOPMENT
Holland & Hart LLP
Denver, Colorado
[Page 2-i]
[Page 2-1]
I. Introduction.
The purpose of this paper is to analyze the important implications of recent decisions by the courts and EPA on the Particulate Matter (PM) National Ambient Air Quality Standards (NAAQS). Probably the most far-reaching of these decisions is EPA's determination that fine and coarse PM are separate and distinct pollutants that should be regulated based on two new sets of PM NAAQS, one for fine PM (PMfine), known as PM2.5, and the other for coarse PM (PMcoarse), based on PM10.
EPA repealed its prior unitary PM10 standard that included varying mixtures of fine and coarse PM, and replaced it with new PMfine and PMcoarse NAAQS in July of 1997. This decision was appealed by numerous environmental and industry trade associations, in cases consolidated under the name of American Trucking Assn. v. EPA, D.C. Cir. No. 97-1440, which was further consolidated with appeals of the ozone NAAQS, promulgated simultaneously with the new PM NAAQS. The decision in that case is without any doubt the most significant administrative law decision rendered by the courts since the Supreme Court's decision in Chevron USA, Inc. v. NRDC, 467 U.S. 837 (1984). Its implications, which are still unfolding, will be treated, as will EPA response and its progress on considering the revision of the PM NAAQS.
Initial sections of the paper will deal with definitional material necessary to understand the continuing controversy over PM and how it affects natural sources development, particularly in the western United States. A glossary of terms and abbreviations used in this paper is contained at the end of the paper.
[Page 2-2]
II. Understanding PM.
A. Coarse PM and Fine PM Are Separate and Different Pollutants
PMfine and PMcoarse are best differentiated by their formation mechanisms, not by their size. (CD at 3-7). PMfine results from nucleation, condensation and conversion of combustion gases. It is, in other words, a secondary pollutant or by product of combustion gases. PMcoarse results from mechanical action on crustal or other materials, and includes dust from surface mining, construction, agriculture, forestry and wind-blown dust. Basic research demonstrates that particles in the atmosphere fall into two distinct modes, with different acidity, chemical composition, solubility, toxicity, ability to impair visibility, origins, atmospheric behavior, and potential effects on health and welfare. (CD, chs.3-5). Figure 1, from EPA's 1982 CD, shows the distribution of typical PMfine and PMcoarse found in samples of urban atmospheres. While there is some overlap of PMfine and PMcoarse in the PM1-PM3 range, nearly all PMfine is below PM1, and nearly all PMcoarse is above PM3. (SP at IV-2, CD, ch.3).
Particulate Matter Falls into a "Bi-Modal" Distribution
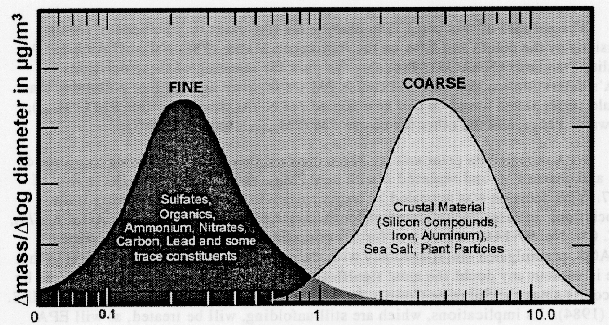
Particle Diameter, µm
Idealized representation of typical fine- and coarse-particle mass and chemical composition distribution in an urban aerosol. Although some overlap exists, note substantial differences in chemical composition of fine versus coarse modes Chemical species of each mode are listed in approximate order of relative modes.contribution. Note that the ordinate is linear and not logarithmic. (EPA, 1982 Criteria Document for PM, p. 1-8)
Figure 1
[Page 2-3]
Figure 2 shows filter papers collecting particles smaller than 2µm(PM2) and larger than 2.5µm (PM2.5). The less than 2µm particles appear black, reflecting their carbonaceous, combustion origin, while those greater than PM2.5 appear grayish-white or brown, reflecting their crustal origin. The 1952 London episode data which served as the primary data for quantifying the 1987 PM10 NAAQS, measured particle "blackness" using a method called British Smoke(BS).
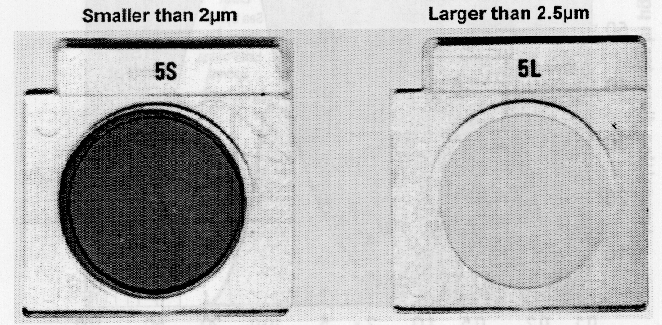
Photos of filters measuring PMfine and PMcoarse in St. Louis, 1973
(From Thomas G. Dzubay and Robert K. Stevens "Ambient Air Analysis with Dichotomous Sampler and X-Ray Fluorescence Spectrometer", Environmental Science and Technology 9 (7), 663, July, 1975)
Figure 2
Figure 3 shows how EPA's regulatory definitions of PM, namely TSP(1970), PM10(1987), and PM2.5(1997) fit the PMfine and PMcoarse modes. The curve designated
[Page 2-4]
by each regulatory definition includes the mass of all PM under the curve down to zero. PM10, for example, includes a portion of the coarse mode and all of the fine mode.
Sampling Fractions for an Idealized Ambient Particulate Mass Distribution
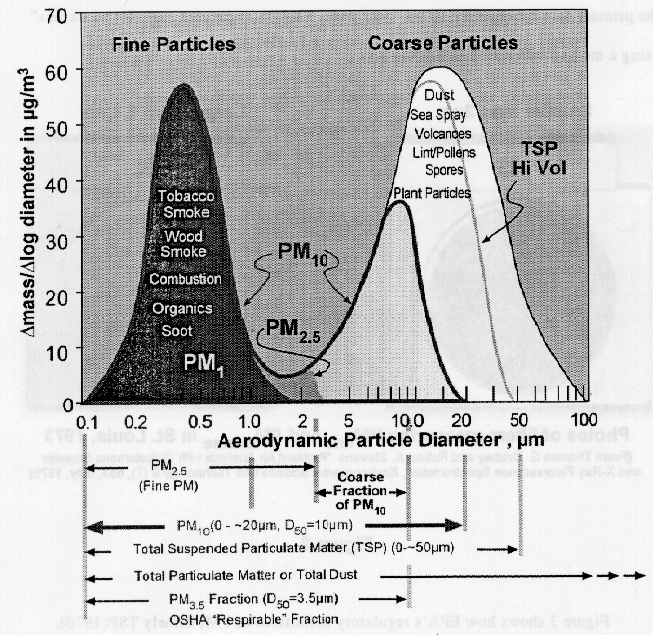
Figure 3
[Page 2-5]
Due to the design and operation of the instruments used, PM10 actually includes particles up to about 20µm. PM3.5, OSHA's definition of "respirable" PM to protect the health of workers, is also indicated. 29 C.F.R.§ 1910.1000 (Tables Z-1, Z-2, Z-3, fn.e)(1997).
In a somewhat typical urban atmosphere in the eastern United States, PM10 may be 80% PMfine and 20% PMcoarse, while in a somewhat typical western, rural atmosphere these ratios are reversed, as illustrated in Figure 4. (See CD, pp. 6-14 to 6-32).
Illustration of Eastern Urban and Arid Western Atmospheres
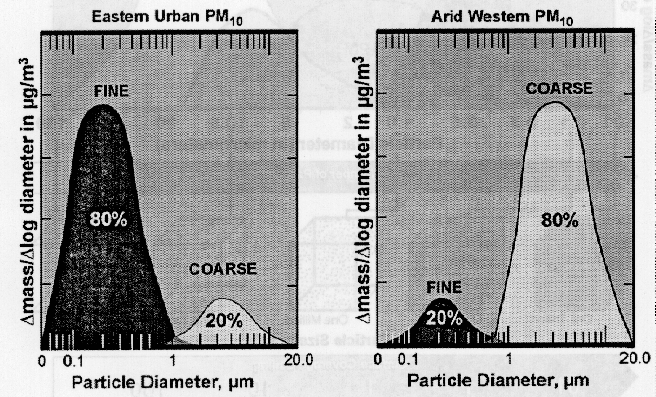
Figure 4
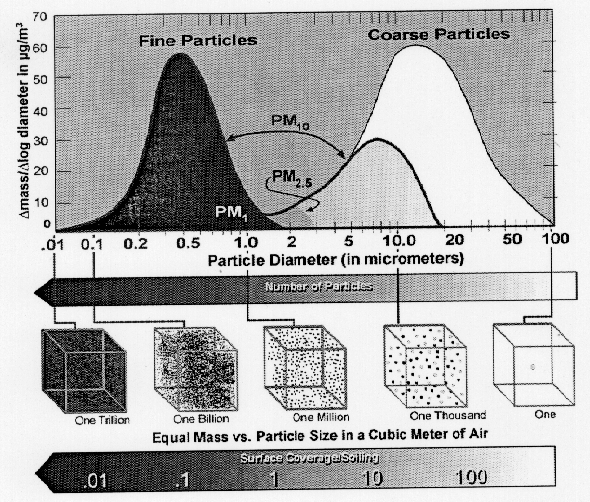
Figure 5 shows how PMfine and PMcoarse are related to the terms of the NAAQS, namely micrograms (millionths of a gram) per cubic meter (µg/m3 ). The standard is
[Page 2-6]
stated in terms of mass per unit volume, roughly the weight of the particles contained in a cubic meter of air. As illustrated in Figure 5, a single 10µm particle will weigh as much — and impact measured compliance with the standard as much — as one thousand 1µm particles or one million 0.1µm particles. This fact results in preferential control of coarse particles.

Figure 5
Fundamental physical and chemical attributes of PM, illustrated in Figures 1-3 and 5, determine the ability of those particles to penetrate the lung's defenses, to be dissolved and absorbed into the body, and to remain suspended in the
[Page 2-7]
atmosphere.(PMfine may remain suspended for tens and hundreds of miles, while PMcoarse generally deposits in a relatively short distance).(CD at 3-145).
B. Occupational Health Regulation of PM: Respirable PM and Total Dust.
The effects of PM on healthy workers is well-understood. It includes regulation of the health effects of coarse PM. OSHA standards for PM fall into two categories, standards for specific substances, such as asbestos and arsenic, and standards for general, "Particles Not Otherwise Regulated" (PNOR). PNOR and inert or nuisance dusts are regulated in two categories, one the "respirable fraction," 5,000 µg/m3 and one for "total dust," 15,000 µg/m3 . The "respirable fraction" is a PM3.5 standard that is close, if not identical, in function and purpose to EPA's new PM2.5 fine particle standard while the "total dust" standard(~PM100) is more akin to the purported purpose of the new coarse PM10 standard. A comparison of these standards is shown in Table 1.
Comparison of OSHA and Ambient Standards in µg/m3
| OSHA | EPA |
| OSHA Respirable PM | 5,000 (PM3.5) (8-hour |
| Time Weighted Average) | |
| EPA Fine PM | 50 (PM2.5) 24-hour average |
| 15 (PM2.5) annual average | |
| OSHA Total Dust | 15,000 (~PM100) (8-hour |
| Time Weighted Average | |
| EPA Coarse PM | 150 (PM10) 24-hour average |
| 50 (PM10) annual average |
TABLE 1
[Page 2-8]
III. The Impact of the PM10 NAAQS, and "Increments" on Western Resource Development.
It is well-established law that EPA may not consider the economic impacts of NAAQS in adopting them. NRDC v. EPA, 902 F.2d 962 (D.C. Cir. 1990). Thus the record of the case, the courts' decisions and even the Regulatory Impact Analysis, are generally devoid of useful information on the impact of the PM NAAQS. EPA generally contends that the promulgation of the PM NAAQS by themselves have no impact, and it is their later implementation, primarily by the States, that has economic impact.
Nevertheless, the broad contours of economic impact of PM10 regulation of PMcoarse sources, particularly on western surface mining, have been considered in several proceedings, such as the adoption of PM10 Prevention of Significant Deterioration (PSD) "increments," and EPA's decision not to include surface coal mines in the PSD permit program. In those proceedings, EPA determined that typical western surface mining operation would be prohibited by the PM10 increments. In the later proceeding, EPA determined not to include coal surface mines as listed PSD "major" sources, because the environmental benefit from doing so was outweighed by the adverse economic impact.
Table 1 shows the PM10 impact of typical, representative surface mining operations (selected by EPA) on the 1987 PM10 ambient air quality levels for mines in Illinois, the Powder River Basin in Wyoming, and the San Juan Basin in New Mexico after the application of BACT. It shows that using standard and required EPA emission factors and models, typical, representative mining operations exceed the 1987 PM10
1987 PM10 STANDARDS AND LEVELS RESULTING FROM MINING: IS COMPLIANCE POSSIBLE?
| Representative Surface Mining Operations in: | Levels Resulting From Mining After BACT | 24-Hour Health & Welfare Standard (NAAQS) | NAAQS Exceedance | PSD Class II Increment | Increment Exceedance |
| Illinois | 844.1 µg/m3 | 150 µg/m3 | 694.1 µg/m3 | 30 µg/m3 | 814 µg/m3 |
| Powder River Basin | 233.2 µg/m3 | 150 µg/m3 | 83.2 µg/m3 | 30 µg/m3 | 203.2 µg/m3 |
| San Juan Basin | 759.0 µg/m3 | 150 µg/m3 | 609 µg/m3 | 30 µg/m3 | 729 µg/m3 |
NAAQS and Prevention of Significant Deterioration increments by tens and hundreds of micrograms per cubic meter, even after the application of BACT.
[Page 2-9]
The western surface mining industry is not alone in being severely constrained or even prohibited at economic scales of operation if the PM NAAQS and increments...
To continue reading
Request your trial